
Climate Risk & Exposure
What does climate security mean for food and farming?
Increased frequency of extreme climate events is now an inevitability. Increase exposure to those risks is a choice.
“Which fields, crops and locations will be hit by heat, drought, flooding? How likely it is this season, next season and beyond? How my on-farm practises increase or decrease exposure to those events? What are the short and medium costs of climate events to my business?“
Sandy answers these and many more questions for every field, for this season and for the decades ahead.
Part of Sandy, Trinity’s natural capital measurement, management, reporting and verification platform.

Exposure to Climate Risk is decided field by field
Exposure to climate events is not evenly spread across a farm. Two fields on the same farm, with the same cropping, can carry very different risk, because of the health of the natural capital. Soil quality, water-holding capacity, nutrient efficiencies and more are determined heavily by the impact of management practices - and understanding whether practices are contributing to the health of a farms’s natural capital is a major factor is managing for climate risk exposure.
The exposure is real, and critical
Most organisations cannot see the true extent of their exposure to climate risk.
Typical climate analytics work on grid cells many kilometres wide and devoid of practical farming insights. They describe the weather, not what it does to a given crop on a given soil and a given management practice.
So climate risk gets managed with isolated methods and coarse averages. And the environmental and agronomic factors that decide whether a field copes, go unmeasured and unmanaged - inflicting unnecessary losses.

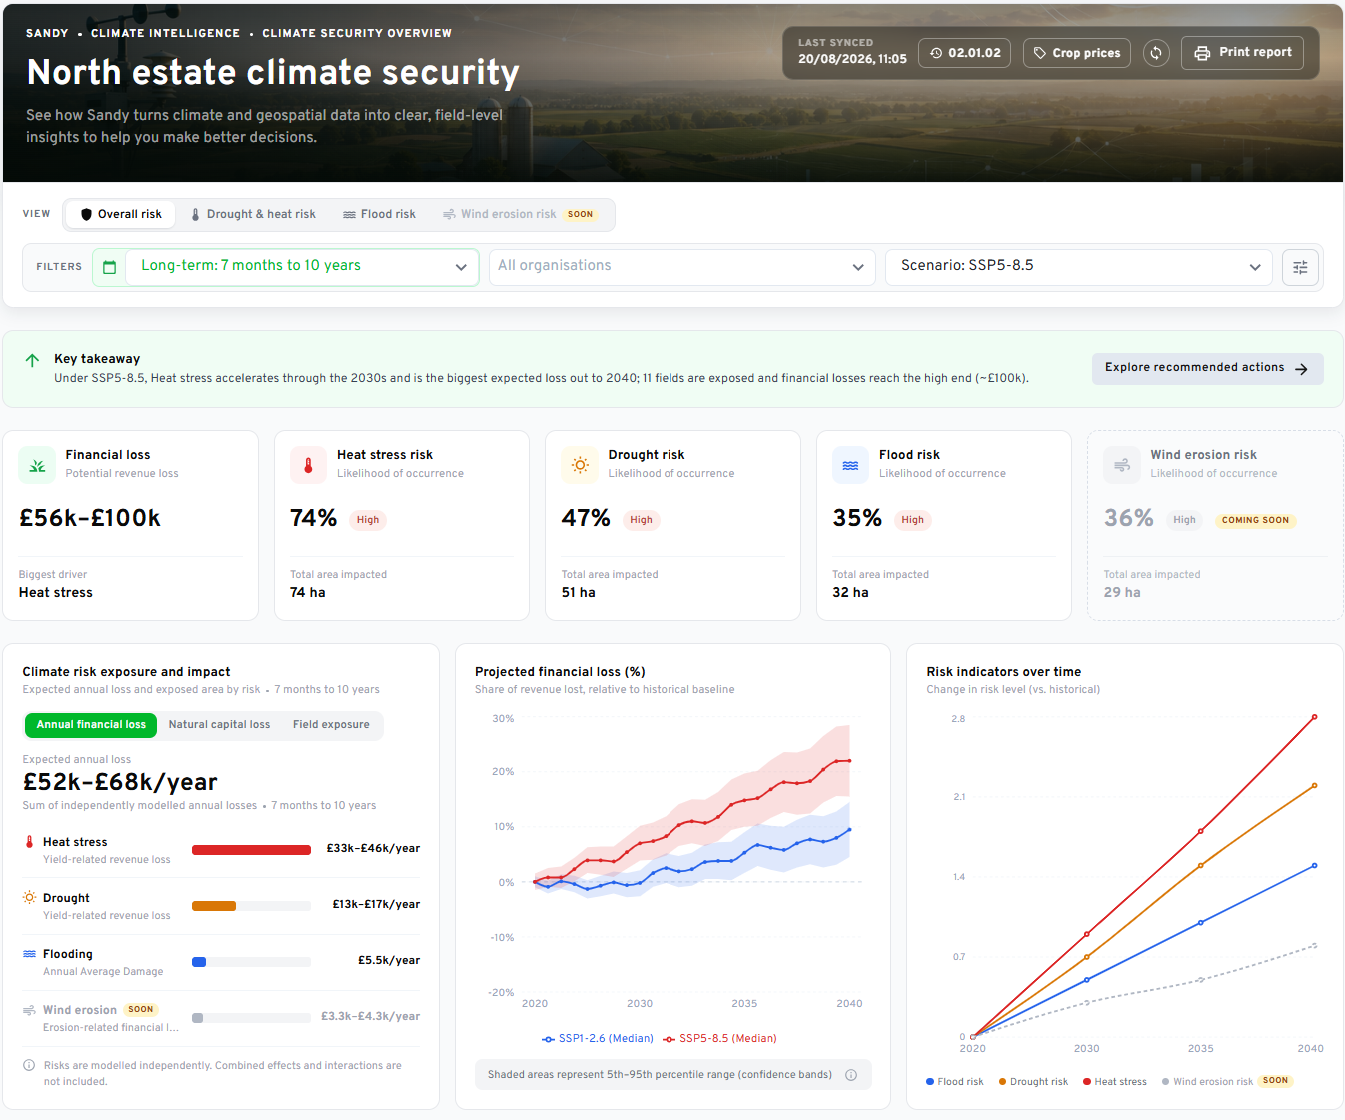
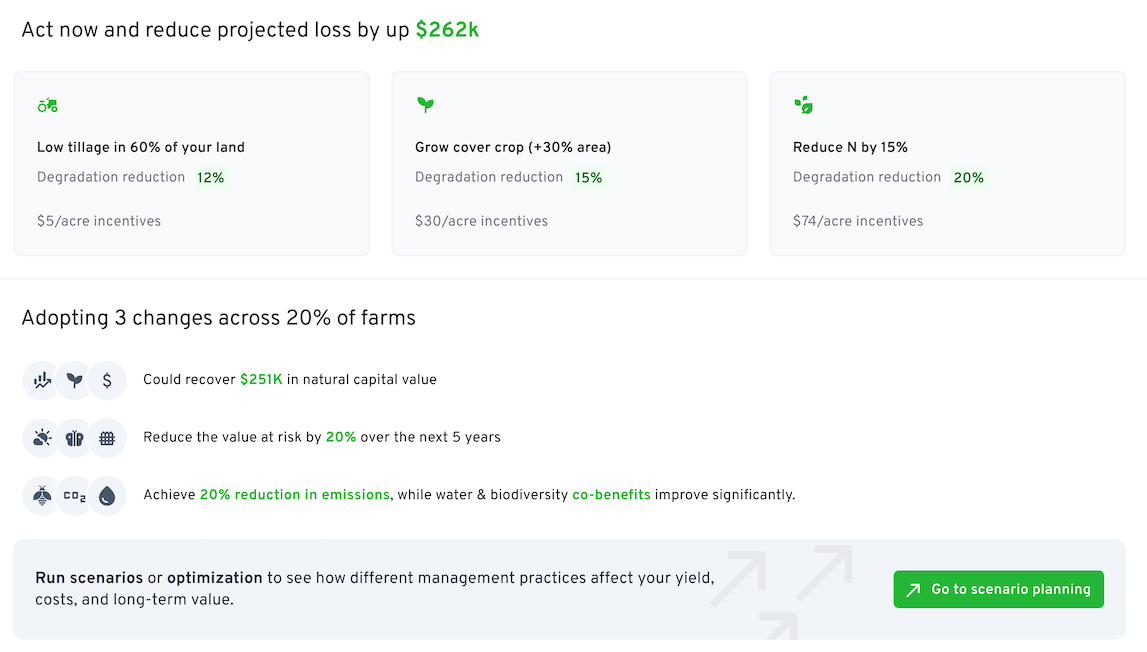
Sandy show the exposure, field by field, and what to do about it
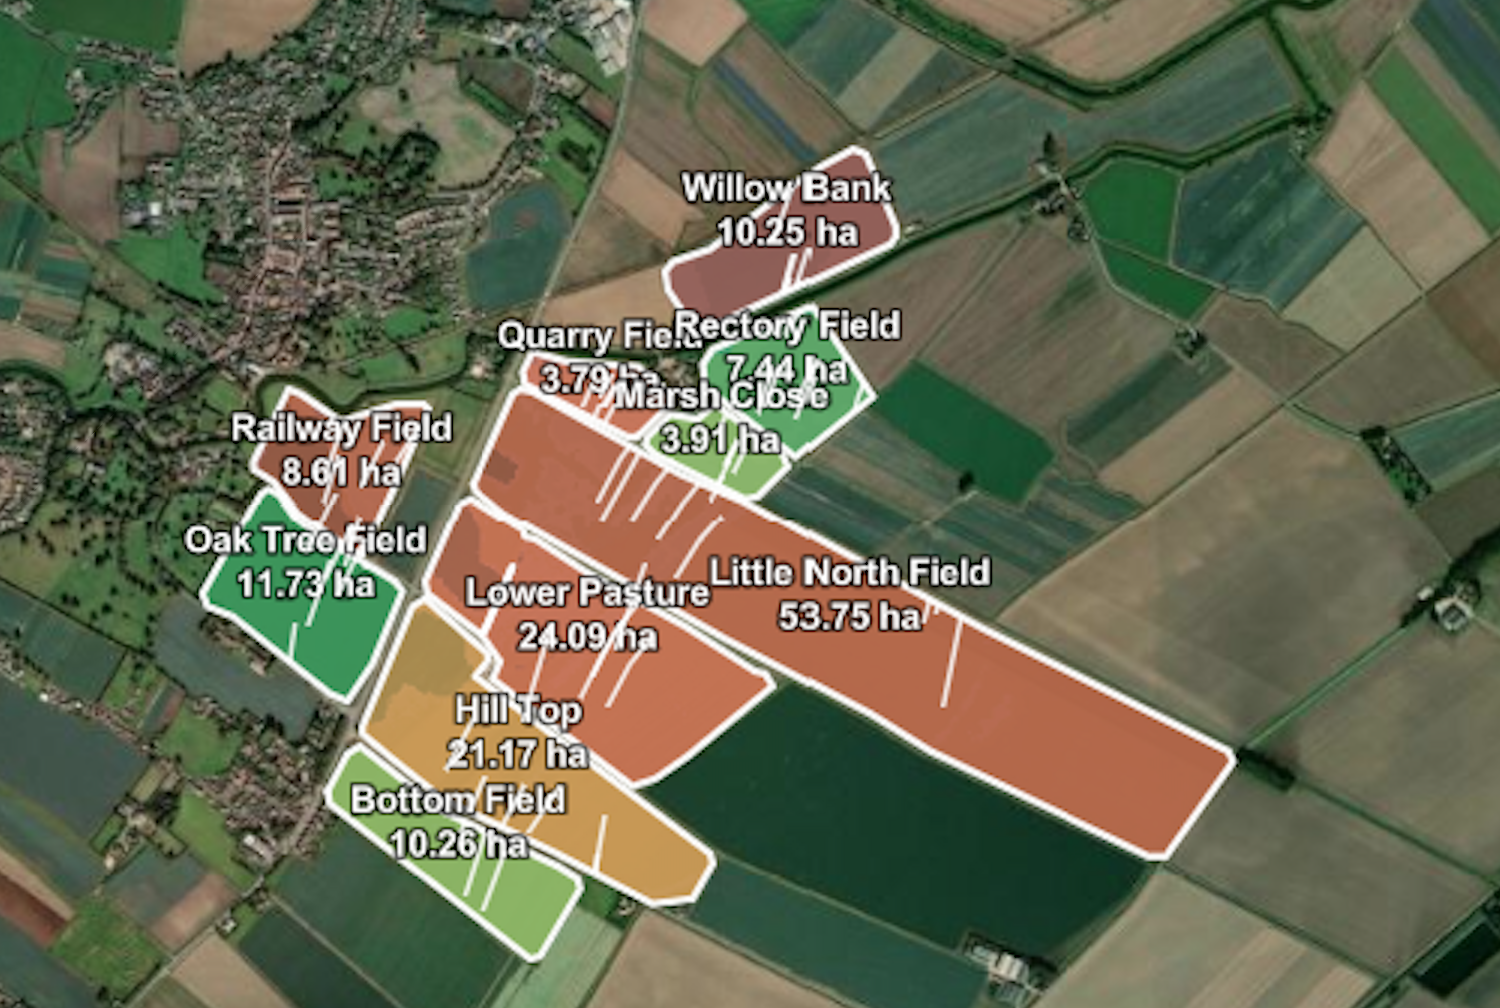
Sandy's climate analytics show which fields, crops and farms are exposed to heat stress, drought and flooding, how likely that is, and what it could cost in yield and revenue. Results are produced for each field and rolled up to farm, supply chain or portfolio.
The analysis models the crop in the field at its current growth stage, using the soil, cropping and management data Sandy already holds. Climate data is brought down from coarse model grids to the individual field. Every result carries a likelihood and a range, and where confidence is low it says so.
It covers this season, on forecasts and seasonal outlooks, and the next fifty years, on climate models under different emissions pathways. The same field data sits under both.
Because the analytics are part of Sandy, exposure is measured alongside soil, water, carbon, biodiversity and productivity for the same fields. A business can see which fields are exposed, why, and which changes to drainage, irrigation, cropping or practice will make the land more resilient. That resilience is a natural capital asset, and Sandy lets it be managed as one.
Climate exposure becomes something to manage, not something to find out about too late.


Climate insights and analytics
| Risk | What is assessed | What is reported |
|---|---|---|
☼ Drought and heatShort and long term |
Water deficit in the soil and temperatures above the crop's threshold, and what each does to yield. |
|
~ FloodRiver, surface water, coastal |
River, surface water and coastal flooding at sub-field resolution, for return periods from 1 in 20 to 1 in 1,000 years, with and without defences. |
|
◆ Soil erosionWater runoff |
Soil loss from water runoff, with the drivers behind it shown for each field. |
|
◎ SolvencyAssets against liabilities |
The natural capital assets held against the climate liabilities from all risks. |
|
Who is it for?

Farming businesses and estates
Which fields are exposed, why, and what to do first: drainage, irrigation, cropping and timing, with climate change built into the plan.

Food and drink companies
Which sourcing regions, growers and crops carry the most risk, to inform contracts, supplier diversification and resilience investment.

Lenders and insurers
Where physical climate risk concentrates in an agricultural book, traced to the fields behind it, to support disclosure and stress testing.

Land agents and consultants
One field-level view across a managed portfolio, to prioritise investment and advise owners and tenants.

Built on Sandy’s data and analytics engine
Climate analytics are part of Sandy, Trinity’s platform for measuring, managing, reporting and verifying natural capital.
Sandy combines local weather, climate, flood and farm data to model climate risks for each field. It uses the same data and leading methods to assess carbon, soil, water, biodiversity and productivity.
Sandy operates within an environment certified to ISO 27001, SOC 2 Type II and Cyber Essentials Plus.
Ready to explore Sandy’s climate insights?
Take the first step towards a resilient, more sustainable farm. Reduce risk, enhance productivity, and secure long-term benefits with Sandy.